

What Kai Built
Open every artifact one prompt produced — the data source, the transformation, the scheduled flow and the app — and check the numbers each one should show.
One prompt produced four things in your project. This page opens each one, tells you what number proves it worked, and names the concept behind it — so the next pipeline you build, you already know where to look. Step 3 of the Getting Started arc.
The data source — four tables in Storage
Section titled “The data source — four tables in Storage”Open Storage. There is a new bucket holding four tables, one per CSV:
| Table | Rows | What it is |
|---|---|---|
occurrences | 10,000 | the sightings — coordinates, depth, year, and a numeric species id |
species | 201 | that id spelled out: scientific name, common name |
depth_zones | 5 | the named ocean layers and their depth ranges |
basins | 13 | ocean basins as latitude/longitude boxes |
The thing that fetched them is a data source connector — in
Components, the configuration Kai named Octopus sightings. Open it and note the
shape: one configuration with four rows, not four configurations. A row is one file with
its own path; they share the configuration’s base URL and its credentials, which is what makes a
connector re-runnable.
The transformation — one table that answers the question
Section titled “The transformation — one table that answers the question”The bucket out.c-octopus-atlas holds a single table, octopus_atlas, at 10,000 rows and
twelve columns.
That row count is the check: it matches occurrences exactly. More than 10,000 would mean a
join double-matched a sighting; fewer would mean an inner join dropped some. Open Data Sample
and you will see the five columns the SQL added — scientific_name, display_name,
depth_zone, basin — beside the seven that arrived in the CSV.
Sort by depth_m descending and the deepest record is Grimpoteuthis challengeri — a dumbo
octopus — at 4,838 meters, in the abyssal zone.
The SQL itself is in Transformations, under the name Kai gave it. It is worth reading once:
the joins onto depth_zones and basins are half-open ranges (>= min AND < max) rather
than BETWEEN, because a sighting sitting exactly on a boundary would otherwise land in two
zones and duplicate its row. That is the kind of detail that shows up in the row count.
The flow — the pipeline, in order, on a clock
Section titled “The flow — the pipeline, in order, on a clock”Flows holds Octopus pipeline with two phases:
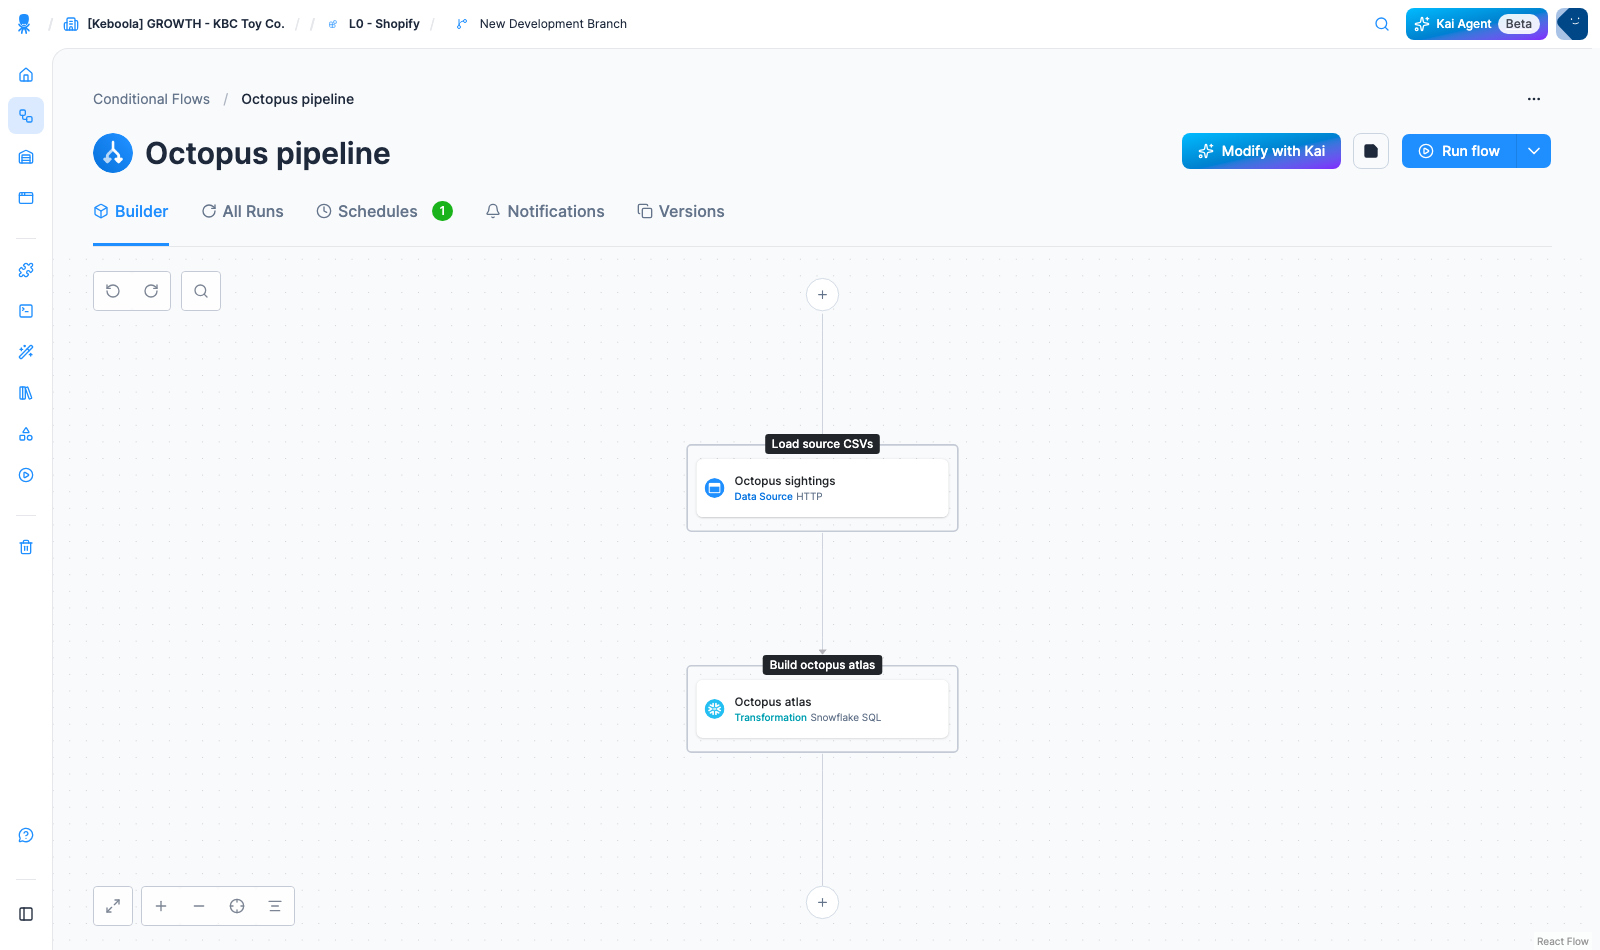
Phases are the ordering guarantee: everything in phase one finishes before phase two starts, so the tables have landed before the SQL reads them. Kai even named the phases after what they do.
The Schedules tab shows At 06:00 AM, every day (UTC). Nothing else needs to happen — from
now on the pipeline rebuilds itself every morning without you. Add yourself to
Notifications and Keboola emails you when a run fails.
The app — the answer, shareable
Section titled “The app — the answer, shareable”Apps holds Octopus map as a draft: a world map of all 10,000 sightings
coloured by depth zone, with filters and a nearest-sighting search. Type your own coordinates and
it answers the question the arc started with. From Prague — 50.08, 14.43 — the nearest recorded
octopus is a musky octopus 495 km away, recorded in 1910.
This is real code, not a template: Kai wrote the frontend, installed its dependencies, type-checked it and committed it to the app’s own git branch. Click Code to read it.
A draft is private to you. Publish to Production deploys it to a URL, and the default authentication is Basic (Password), so the map is not public until you decide who gets the link. To change anything, tell Kai in the same chat — make the depth-zone colours warmer, add a year filter — and publish again.
What you now know
Section titled “What you now know”Four concepts, one prompt:
- a data source connector fetches from outside, on demand or on a schedule;
- a transformation reads tables and writes tables, and cannot touch anything it did not declare in its mapping;
- a flow runs components in ordered phases, on a clock, and tells you when it breaks;
- a data app turns a Storage table into something a colleague can use.
Every one of them is a component, and the pattern never changes: configure, run, check the output in Storage.
If it came out different
Section titled “If it came out different”Kai is not deterministic, and your project is not our project. The usual differences:
- Different names. If you left the names out of the prompt, Kai invents them. Rename anything in the UI, or ask it to.
- Fewer or more rows. If
octopus_atlasis not 10,000, a join went wrong. Paste the number back:octopus_atlas has 24,113 rows instead of 10,000 — find the join that duplicates rows and fix it. - A different backend. On a BigQuery project the SQL is BigQuery SQL. The concepts are identical; only the dialect changes.
- Nothing built, just an answer. Read-only questions get answered rather than built. Say create or build when you mean it.
Next: Build the same thing by hand → — the click-through version of every step above, for when you want to know exactly where each setting lives.